From a series of articles “What to do if it’s cold in the apartment”
What's happened - temperature graph?
The water temperature in the heating system must be maintained depending on the actual outside air temperature according to a temperature schedule, which is developed by heating engineers of design and energy supply organizations using a special methodology for each heat supply source, taking into account specific local conditions. These schedules should be developed based on the requirement that during the cold period of the year, living rooms are maintained optimal temperature* equal to 20 – 22 °C.
When calculating the schedule, heat losses (water temperature) in the area from the heat supply source to residential buildings are taken into account.
Temperature graphs must be drawn up both for the heating network at the outlet of the heat supply source (boiler house, thermal power plant), and for pipelines after the heating points of residential buildings (groups of houses), i.e. directly at the entrance to the heating system of the house.
From heat supply sources to heating network Hot water is supplied according to the following temperature schedules:*
- from large thermal power plants: 150/70°C, 130/70°C or 105/70°C;
- from boiler houses and small thermal power plants: 105/70°C or 95/70°C.
*first digit – Maximum temperature direct network water, the second digit is its minimum temperature.
Depending on specific local conditions, other temperature schedules may apply.
Thus, in Moscow, at the outlet of the main heat supply sources, schedules of 150/70°C, 130/70°C and 105/70°C (maximum/minimum water temperature in the heating system) are used.
Until 1991, such temperature schedules were approved annually before the autumn-winter heating season by the administrations of cities and other settlements, which was regulated by the relevant regulatory and technical documents (NTD).
Subsequently, unfortunately, this norm disappeared from the NTD; everything was handed over to those “who care for the people”, but at the same time, who did not want to miss out on profits to the owners of boiler houses, thermal power plants, and other factories - steamships.
However regulatory requirement the mandatory compilation of heating temperature schedules was restored by Federal Law No. 190-FZ of July 27, 2010 “On Heat Supply”. This is what Federal Law 190 regulates temperature chart(the articles of the Law are arranged by the author in their logical sequence):
“...Article 23. Organization of the development of heat supply systems for settlements and urban districts
…3. Authorized... bodies [see. Art. 5 and 6 FZ-190] must carry out development, statement and annual updating* *
heat supply schemes, which must contain:
…7) Optimal temperature schedule…
Article 20. Checking readiness for heating season
…5. Checking readiness for heating. period of heat supply organizations... is carried out in order to...readiness of these organizations to fulfill the heat load schedule, maintaining the temperature schedule approved by the heat supply scheme…
Article 6. Powers of local self-government bodies of settlements and urban districts in the field of heat supply
1. The powers of local self-government bodies of settlements and urban districts to organize heat supply in the relevant territories include:
…4) fulfillment of the requirements established by the rules for assessing the readiness of settlements and urban districts for the heating season, and readiness control heat supply organizations, heating network organizations, certain categories of consumers to the heating season;
…6) approval of heat supply schemes settlements, urban districts with a population of less than five hundred thousand people...;
Article 4, paragraph 2. To the powers of the fed. Spanish organ authorities authorized to implement state heat supply policies include:
11) approval of heat supply schemes for settlements, mountains. counties with a population of five hundred thousand people or more...
Article 29. Final provisions
…3. Approval of heat supply schemes for settlements ... must be carried out before December 31, 2011.”
And here is what is said about heating temperature schedules in the “Rules and Standards for the Technical Operation of Housing Stock” (approved by the Post of the State Construction Committee of the Russian Federation dated September 27, 2003 No. 170):
“...5.2. Central heating
5.2.1. The operation of the central heating system of residential buildings must ensure:
- maintaining optimal (not lower than permissible) air temperature in heated rooms;
- maintaining the temperature of water entering and returning from the heating system in accordance with the schedule quality regulation water temperature in the heating system (Appendix No. 11);
- uniform heating of all heating devices;
5.2.6. The operating personnel premises must have:
...e) a graph of the temperature of the supply and return water in the heating network and in the heating system depending on the outside air temperature, indicating the operating pressure of the water at the inlet, the static and the highest permissible pressure in the system;..."
Due to the fact that home heating systems can be supplied with coolant with a temperature no higher than: for two-pipe systems - 95 ° C; for single-pipe - 105 ° C, at heating points (individual house or group for several houses) before supplying water to houses, hydraulic elevator units are installed in which direct network water, which has a high temperature, is mixed with cooled return water returning from the home heating system. After mixing in the hydraulic elevator, the water enters house system with a temperature according to the “house” temperature chart of 95/70 or 105/70°C.
Below, as an example, is the temperature graph of the heating system after heating point residential building for radiators according to the top-down and bottom-up scheme (at intervals outside temperature 2 °C), for a city with an estimated outside air temperature of 15 °C (Moscow, Voronezh, Orel):
WATER TEMPERATURE IN DISTRIBUTION PIPELINES, degrees. C
AT DESIGNED OUTSIDE AIR TEMPERATURE
|
current outside temperature, |
diagram of water supply to radiators |
|||
|
"down up" |
"top down" |
|||
|
server |
back |
server |
back |
|
Explanations:
1. In gr. 2 and 4 show the water temperature in the supply pipe of the heating system:
in the numerator - with an estimated water temperature difference of 95 - 70 °C;
in the denominator - with a calculated difference of 105 - 70 °C.
In gr. 3 and 5 show the water temperatures in the return pipeline, which are identical in their values at calculated differences of 95 - 70 and 105 - 70 °C.
Temperature graph of the heating system of a residential building after a heating point
Source: Rules and regulations technical operation housing stock, adj. 20
(approved by order of the State Construction Committee of the Russian Federation dated December 26, 1997 No. 17-139).
Operating since 2003 “Rules and standards for technical operation of housing stock”(approved by the Post of the State Construction Committee of the Russian Federation dated September 27, 2003 No. 170), appendix. eleven.
|
Current temperature outdoor tour |
Heating device design |
|||||||||
|
radiators |
convectors |
|||||||||
|
water supply diagram to the device |
convector type |
|||||||||
|
"top down" |
||||||||||
|
water temperature in distribution pipelines, degrees. C |
||||||||||
|
back |
server |
back |
server |
back |
server |
back |
server |
back |
||
|
DESIGN OUTDOOR AIR TEMPERATURE |
||||||||||
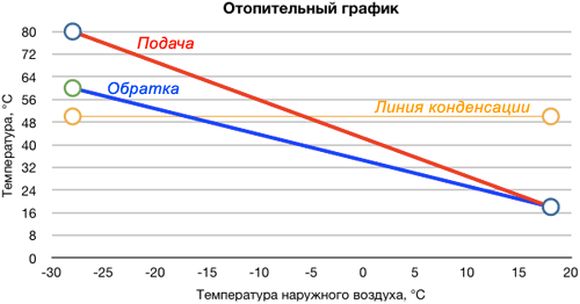
The basis for an economical approach to energy consumption in a heating system of any type is the temperature schedule. Its parameters indicate optimal value heating water, thereby optimizing costs. In order to apply this data in practice, it is necessary to learn in more detail the principles of its construction.
Terminology
Temperature graph – the optimal value of heating the coolant to create a comfortable temperature in the room. It consists of several parameters, each of which directly affects the quality of operation of the entire heating system.
- Temperature in the inlet and outlet pipes of the heating boiler.
- The difference between these coolant heating indicators.
- Temperature indoors and outdoors.
The latter characteristics are decisive for the regulation of the first two. Theoretically, the need to increase the heating of water in the pipes occurs when the temperature outside decreases. But how much do you need to increase so that the heating of the air in the room is optimal? To do this, draw up a graph of the dependence of the parameters of the heating system.
When calculating it, the parameters of the heating system and the residential building are taken into account. For central heating The following system temperature parameters are accepted:
- 150°C/70°C. Before reaching the users, the coolant is diluted with water from the return pipe to normalize the incoming temperature.
- 90°C/70°C. In this case, there is no need to install equipment for mixing the flows.
According to current system parameters utility services must ensure compliance with the heating value of the coolant in the return pipe. If this parameter is less than normal, it means that the room is not heated properly. Exceeding indicates the opposite - the temperature in the apartments is too high.
Temperature chart for a private house
The practice of drawing up such a schedule for autonomous heating is not very developed. This is explained by its fundamental difference from the centralized one. The water temperature in the pipes can be controlled manually or automatically. If during the design and practical implementation the installation of sensors for automatic regulation operation of the boiler and thermostats in each room, then there will be no urgent need to calculate the temperature schedule.
But it will be indispensable for calculating future expenses depending on weather conditions. In order to draw it up in accordance with the current rules, the following conditions must be taken into account:

Only after these conditions have been met can we proceed to the calculation part. Difficulties may arise at this stage. Correct calculation of an individual temperature schedule is a complex mathematical scheme that takes into account all possible indicators.
However, to make the task easier, there are ready-made tables with indicators. Below are examples of the most common operating modes heating equipment. The following input data were taken as initial conditions:
- Minimum air temperature outside – 30°C
- The optimal room temperature is +22°C.
Based on these data, schedules were drawn up for the following types of operation of heating systems.

It is worth remembering that these data do not take into account the design features of the heating system. They only show the recommended temperature and power values of heating equipment depending on weather conditions.
After installing the heating system, you need to configure temperature regime. This procedure must be carried out in accordance with existing standards.
The coolant temperature requirements are set out in regulatory documents, which establish the design, installation and use engineering systems residential and public buildings. They are described in the State Building Codes and Rules:
- DBN (V. 2.5-39 Heat networks);
- SNiP 2.04.05 “Heating, ventilation and air conditioning.”
For design temperature of water in the supply, the figure that is equal to the temperature of the water leaving the boiler, according to its passport data, is accepted.
For individual heating deciding what the coolant temperature should be should take into account the following factors:
- Start and end heating season By average daily temperature outside +8 °C for 3 days;
- The average temperature inside heated premises of housing, communal and public importance should be 20 °C, and for industrial buildings 16 °C;
- The average design temperature must comply with the requirements of DBN V.2.2-10, DBN V.2.2.-4, DSanPiN 5.5.2.008, SP No. 3231-85.
According to SNiP 2.04.05 “Heating, ventilation and air conditioning” (clause 3.20), the coolant limit values are as follows:

Depending on the external factors, the water temperature in the heating system can be from 30 to 90 °C. When heated above 90 °C, dust and paintwork. For these reasons sanitary standards more heating is prohibited.
For calculation optimal performance Special graphs and tables can be used that define the norms depending on the season:
- With an average reading outside the window of 0 °C, the supply for radiators with different wiring is set at 40 to 45 °C, and the return temperature at 35 to 38 °C;
- At -20 °C, the supply is heated from 67 to 77 °C, and the return rate should be from 53 to 55 °C;
- At -40 °C outside the window, all heating devices are set to the maximum permissible values. On the supply side it is from 95 to 105 °C, and on the return side it is 70 °C.
Optimal values in an individual heating system
H2_2Heating system helps to avoid many problems that arise with centralized network, and the optimal coolant temperature can be adjusted according to the season. In the case of individual heating, the concept of standards includes the heat transfer of a heating device per unit area of the room where this device is located. The thermal regime in this situation is ensured design features heating devices.
It is important to ensure that the coolant in the network does not cool below 70 °C. The optimal temperature is considered to be 80 °C. WITH gas boiler It is easier to control heating because manufacturers limit the ability to heat the coolant to 90 °C. Using sensors to regulate the gas supply, the heating of the coolant can be adjusted.
It is a little more difficult with solid fuel devices; they do not regulate the heating of the liquid, and can easily turn it into steam. And it is impossible to reduce the heat from coal or wood by turning the knob in such a situation. Control of heating of the coolant is quite conditional with high errors and is carried out by rotary thermostats and mechanical dampers.
Electric boilers allow you to smoothly regulate the heating of the coolant from 30 to 90 °C. They are equipped with an excellent overheat protection system.
Single-pipe and double-pipe lines
The design features of one-pipe and two-pipe heating networks determine different standards for heating the coolant.
For example, for a single-pipe main the maximum norm is 105 °C, and for a two-pipe main it is 95 °C, while the difference between the return and supply should be respectively: 105 - 70 °C and 95 - 70 °C.
Coordination of coolant and boiler temperatures
 Regulators help coordinate the temperature of the coolant and the boiler. These are devices that create automatic control and adjustment of return and supply temperatures.
The return temperature depends on the amount of liquid passing through it. Regulators cover the liquid supply and increase the difference between the return and supply to the level required, and the necessary indicators are installed on the sensor.
If the flow needs to be increased, a boost pump can be added to the network, which is controlled by a regulator. To reduce the heating of the supply, a “cold start” is used: that part of the liquid that has passed through the network is again transported from the return to the inlet.
The regulator redistributes the supply and return flows according to the data collected by the sensor and ensures strict temperature standards heating networks.
Ways to reduce heat loss
 The above information will help to be used for correct calculation coolant temperature standards and will tell you how to determine situations when you need to use a regulator.
But it is important to remember that the temperature in the room is affected not only by the temperature of the coolant, street air and wind strength. The degree of insulation of the facade, doors and windows in the house should also be taken into account.
To reduce heat loss from your home, you need to worry about its maximum thermal insulation. Insulated walls, sealed doors, metal-plastic windows will help reduce heat loss. This will also reduce heating costs.
Each Management Company strive to achieve economical costs for heating an apartment building. In addition, residents of private houses are trying to come. This can be achieved by drawing up a temperature graph that reflects the dependence of the heat produced by the carriers on the weather conditions outside. Proper Use This data allows you to optimally distribute hot water and heating to consumers.
What is a temperature graph
The coolant should not maintain the same operating mode, because outside the apartment the temperature changes. This is what you need to be guided by and, depending on it, change the temperature of the water in heating objects. The dependence of the coolant temperature on the outside air temperature is compiled by technologists. To compile it, the values available for the coolant and the outside air temperature are taken into account.
During the design of any building, the size of the heat-providing equipment installed in it, the dimensions of the building itself and the cross-sections available in the pipes must be taken into account. IN high-rise building Residents cannot independently increase or decrease the temperature, since it is supplied from the boiler room. Adjustment of the operating mode is always carried out taking into account the temperature curve of the coolant. The temperature scheme itself is also taken into account - if the return pipe supplies water with a temperature above 70°C, then the coolant flow will be excessive, but if it is significantly lower, there will be a deficiency.
Important! The temperature schedule is drawn up in such a way that at any outside air temperature in the apartments a stable optimal heating level is maintained at 22 °C. Thanks to it, even the most severe frosts are not scary, because the heating systems will be ready for them. If it is -15 °C outside, then it is enough to track the value of the indicator to find out what the temperature of the water in the heating system will be at that moment. The harsher the weather outside, the hotter the water inside the system should be.
But the level of heating maintained indoors depends not only on the coolant:
- Outside temperature;
- The presence and strength of wind - its strong gusts significantly affect heat loss;
- Thermal insulation - high-quality structural parts of the building help to retain heat in the building. This is done not only during the construction of the house, but also separately at the request of the owners.
Table of coolant temperature versus outside air temperature
In order to calculate the optimal temperature regime, you need to take into account the characteristics of heating devices - batteries and radiators. The most important thing is to count them power density, it will be expressed in W/cm2. This will most directly affect the transfer of heat from the heated water to the heated air in the room. It is important to take into account their surface power and the drag coefficient available window openings and external walls.
After all the values have been taken into account, you need to calculate the difference between the temperature in two pipes - at the entrance to the house and at the exit from it. The higher the value in the input pipe, the higher the value in the return pipe. Accordingly, indoor heating will increase under these values.
| Weather outside, C | at the entrance to the building, C | Return pipe, C |
| +10 | 30 | 25 |
| +5 | 44 | 37 |
| 0 | 57 | 46 |
| -5 | 70 | 54 |
| -10 | 83 | 62 |
| -15 | 95 | 70 |
Proper use of coolant involves attempts by house residents to reduce the temperature difference between the inlet and outlet pipes. It could be construction work for insulating a wall from the outside or thermal insulation of external heat supply pipes, insulating floors above a cold garage or basement, insulating the inside of a house, or several works performed simultaneously.
Heating in the radiator must also comply with the standards. In central heating systems it usually varies from 70 C to 90 C depending on the outside air temperature. It is important to consider that in corner rooms the temperature cannot be less than 20 C, although in other rooms of the apartment a decrease to 18 C is allowed. If the temperature outside drops to -30 C, then the heating in the rooms should rise by 2 C. In other rooms it should also temperature rise provided that in the rooms for various purposes it may be different. If there is a child in the room, then it can vary from 18 C to 23 C. In storerooms and corridors, heating can vary from 12 C to 18 C.
It is important to note! The average daily temperature is taken into account - if the temperature at night is about -15 C, and during the day - -5 C, then it will be calculated according to the value of -10 C. If at night it was about -5 C, and in the daytime it rose to +5 C, then heating is taken into account at the value of 0 C.
Schedule for hot water supply to the apartment
In order to deliver optimal hot water to the consumer, CHP plants must send it as hot as possible. Heating lines are always so long that their length can be measured in kilometers, and the length of apartments is measured in thousands. square meters. Whatever the insulation of the pipes, heat is lost on the way to the user. Therefore, it is necessary to heat the water as much as possible. 
However, water cannot be heated above its boiling point. Therefore, a solution was found - to increase the pressure.
It is important to know! As it increases, the boiling point of water shifts upward. As a result, it reaches the consumer really hot. When the pressure increases, risers, mixers and taps are not affected, and all apartments up to the 16th floor can be provided with hot water supply without additional pumps. In a heating main, water usually contains 7-8 atmospheres, the upper limit is usually 150 with a margin.
It looks like this:
| Boiling temperature | Pressure |
| 100 | 1 |
| 110 | 1,5 |
| 119 | 2 |
| 127 | 2,5 |
| 132 | 3 |
| 142 | 4 |
| 151 | 5 |
| 158 | 6 |
| 164 | 7 |
| 169 | 8 |
Innings hot water V winter time year must be continuous. Exceptions to this rule include heat supply accidents. Hot water supply can only be turned off in summer period for preventive maintenance. Such work is carried out both in heat supply systems closed type, and in open systems.
There are a number of patterns on the basis of which the coolant temperature changes in central heating. To track fluctuations, there are special graphs called temperature graphs. What they are and what they are needed for needs to be understood in more detail.
What is a temperature chart and its purpose?
The temperature graph of a heating system is the dependence of the temperature of the coolant, which is water, on the temperature of the outside air.
The main indicators of the graph under consideration are two values:
- The temperature of the coolant, that is, the heated water that is supplied to the heating system to heat residential premises.
- Outdoor air temperature readings.
The lower the ambient temperature, the more it is necessary to heat the coolant that is supplied to the heating system. The schedule under consideration is constructed when designing heating systems for buildings. It depends on indicators such as size heating devices, coolant flow in the system, as well as the diameter of the pipelines through which the coolant is transferred.
The temperature graph is indicated using two numbers, which are 90-70 degrees. What does this mean? These numbers characterize the temperature of the coolant that must be supplied to the consumer and returned back. To create comfortable conditions indoors in winter period at an outside air temperature of -20 degrees, you need to supply coolant to the system with a value of 90 degrees Celsius, and return with a value of 70 degrees.

The temperature graph allows you to determine whether the coolant flow rate is too high or low. If the temperature of the returned coolant is too high, this will indicate a high flow rate. If the value is underestimated, this indicates a consumption deficit.
The 95-70 degree schedule for the heating system was adopted in the last century for buildings up to 10 floors. If the number of floors in a building exceeds 10 floors, then the values taken were 105-70 degrees. Modern heat supply standards for each new building are different, and are often adopted at the discretion of the designer. Modern standards for insulated houses are 80-60 degrees, and for buildings without insulation 90-70.
Why do temperature fluctuations occur?
The reasons for temperature changes are determined by the following factors:
- When weather conditions change, heat loss automatically changes. When cold weather sets in, to ensure optimal microclimate in apartment buildings it is necessary to spend more thermal energy than with warming. The level of heat loss consumed is calculated by the “delta” value, which is the difference between the street and indoors.
- Constancy heat flow from batteries is ensured by a stable temperature of the coolant. As soon as the temperature decreases, apartment radiators will become increasingly warmer. This phenomenon is facilitated by an increase in the “delta” between the coolant and the air in the room.
The increase in coolant losses must be carried out in parallel with the decrease in air temperature outside the window. The colder it is outside, the higher the temperature of the water in the heating pipes should be. To facilitate the calculation processes, a corresponding table has been adopted.
What is a temperature graph
The temperature graph for coolant supply to heating systems is a table that lists the coolant temperature values depending on the outside air temperature.
Generalized graph of water temperature in heating system is the following:

The formula for calculating the temperature graph is as follows:
- To determine the coolant supply temperature: T1=tin+∆xQ(0.8)+(β-0.5xUP)xQ.
- To determine the return supply temperature, the formula is used: T2=tin+∆xQ(0.8)-0.5xUPxQ.
In the presented formulas:
Q – relative heating load.
∆ is the temperature pressure of the coolant supply.
β – temperature difference in forward and reverse supply.
UP is the difference in water temperature at the inlet and outlet of the heating device.
There are two types of graphs:
- For heating networks.
- For apartment buildings.
To understand the details, let’s consider the features of the functioning of centralized heating.
CHP and heating networks: what is the relationship
The purpose of thermal power plants and heating networks is to heat the coolant to a certain value, and then transport it to the place of consumption. It is important to take into account the losses on the heating main, the length of which is usually 10 kilometers. Despite the fact that all water supply pipes are thermally insulated, it is almost impossible to avoid heat losses.
When the coolant moves from a thermal power plant or simply a boiler house to the consumer (apartment building), a certain percentage of water cooling is observed. To ensure the supply of coolant to the consumer at the required standardized value, it is required to be supplied from the boiler room in the maximum heated state. However, it is impossible to increase the temperature above 100 degrees, since it is limited by the boiling point. However, it can be shifted towards increasing the temperature value by increasing the pressure in the heating system.
The pressure in the pipes according to the standard is 7-8 atmospheres, however, when the coolant is supplied, a loss of pressure also occurs. However, despite the pressure loss, a value of 7-8 atmospheres allows for efficient operation of the heating system even in 16-story buildings.
This is interesting! The pressure in the heating system of 7-8 atmospheres is not dangerous for the network itself. All structural elements remain operational in normal mode.
Taking into account the reserve of the upper temperature threshold, its value is 150 degrees. The minimum supply temperature at sub-zero temperatures outside the window is not below 9 degrees. The return temperature is usually 70 degrees.
How coolant is supplied to the heating system
The following restrictions apply to the home heating system:
- The maximum heating indicator is determined by a limited value of +95 degrees for a two-pipe system, as well as 105 degrees for a single-pipe network. In preschool educational institutions, stricter restrictions apply. The water temperature in the battery should not rise above 37 degrees. To compensate for the reduced temperature, additional sections of radiators are built up. Kindergartens that are located directly in regions with harsh climatic zones, are equipped with a large number of radiators with numerous sections.
- The best option is to achieve the minimum “delta” value, which represents the difference between the supply and return values of the coolant temperature. If you do not achieve this value, then the degree of heating of the radiators will have a large difference. To reduce the difference, it is necessary to increase the speed of the coolant. However, even with an increase in the speed of movement of the coolant, significant drawback, which is due to the fact that water will be returned back to the thermal power plant with excessive high temperature. This phenomenon can lead to disruptions in the functioning of the thermal power plant.
To get rid of such a problem, you should apartment building install elevator modules. Through such devices, a portion of supply and return water is diluted. This mixture will allow for accelerated circulation, thereby eliminating the possibility of excessive overheating of the return pipeline.

If an elevator is installed in a private house, then the accounting of the heating system is set using an individual temperature schedule. Two-pipe heating systems in a private house are characterized by 95-70 degrees, and single-pipe heating systems by 105-70 degrees.
How climate zones affect air temperature
The main factor that is taken into account when calculating the temperature schedule is presented in the form of the calculated temperature in winter. When calculating heating, the outside air temperature is taken from a special table for climatic zones.
Table temperature coolant should be compiled so that its maximum value satisfies the SNiP temperature in residential premises. For example, we use the following data:
- Radiators are used as heating devices, which supply coolant from bottom to top.
- The type of apartment heating is two-pipe, equipped with parking pipe distribution.
- The calculated values of the outside air temperature are -15 degrees.
In this case we receive the following information:
- Heating will be started when the average daily temperature does not exceed +10 degrees for 3-5 days. The coolant supply will be carried out at a value of 30 degrees, and the return will be equal to 25 degrees.
- When the temperature drops to 0 degrees, the coolant value increases to 57 degrees, and the return flow will be 46 degrees.
- At -15, water will be supplied at a temperature of 95 degrees, and the return will be 70 degrees.
This is interesting! When determining the average daily temperature, information is taken from both daytime thermometer readings and nighttime measurements.
How to regulate temperature
CHP workers are responsible for the parameters of heating mains, but monitoring of networks inside residential buildings is carried out by employees of the housing office or management companies. The Housing Office often receives complaints from residents that their apartments are cold. To normalize the system parameters, you will need to take the following measures:
- Increasing the nozzle diameter or installing an elevator with adjustable nozzle. If there is an underestimated value of the liquid temperature in the return, then this problem can be solved by increasing the diameter of the elevator nozzle. To do this, you need to close the latches and valves, and then remove the module. The nozzle is enlarged by drilling it by 0.5-1 mm. After completing the procedure, the device is returned to its place, after which the procedure of bleeding air from the system must be carried out.
- Stop the choke. To avoid the threat of the suction pump performing the function of a jumper, it is silenced. To perform this procedure, a steel pancake is used, the thickness of which should be about 1 mm. This method of temperature control belongs to the category of emergency options, since when it is carried out, it is possible that a temperature jump of up to +130 degrees may occur.
- Regulation of differences. The problem can be resolved by adjusting the differences with an elevator valve. The essence of this correction method is to redirect the hot water to the supply pipe. A pressure gauge is screwed into the return pipe, after which the valve of the return pipeline is closed. When opening the valve, you need to check the pressure gauge readings.
If you install a conventional valve, this will lead to the system stopping and freezing. To reduce the difference, you need to increase the return pressure to 0.2 atm/day. You can find out what temperature the batteries should be based on the temperature graph. Knowing its value, you can check to ensure its compliance with the temperature regime.
In conclusion, it should be noted that options for suppressing suction and regulating differences are used exclusively in the development of critical situations. Knowing this minimum of information, you can contact the housing office or thermal power plant with complaints and wishes about the coolant in the system that does not meet the standards.